Discover more from Investor Charts / P1 Analytics
Transition Trading Setups
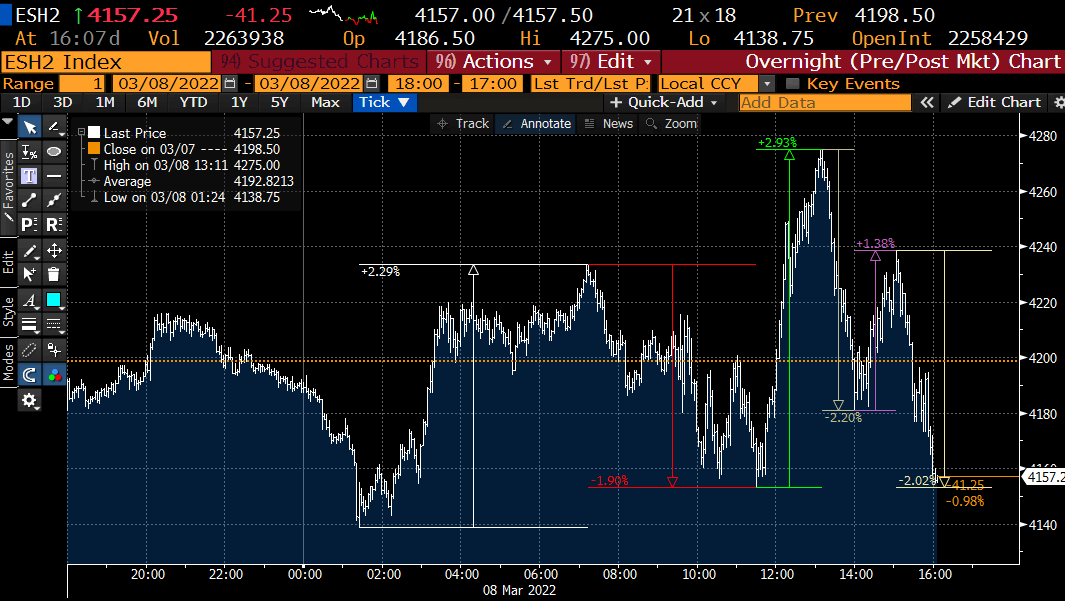
What a wild day. I shared this chart on twitter, but the net cumulative intraday swings in S&P futures today (10.62%, and that is not even including the Asia session) was greater than the 100 annualized average return.
What does that mean? Well besides brokers getting absolutely minted on everyone turning their positions over, I think it just means volatility is here and we need to be very selective. Extra selective even. Here are some really good risk-reward setups in my view.
SHOP coming into key support zone.
MSTR key multi-decade trend line that has worked to trade off of. Sorry to [list of friends short MSTR] but it might be time to cash in some chips if the bears can't push it through the recent swing low.
IWM on the verge of falling off a massive cliff, yet still holding even as stocks make new relative swing lows. Divergences are currently present.
AMZN topped, for a long time. Most likely more likely to have a mean reversion move back higher here in the medium term though. Been calling the 3200 re-short for a month.
Bitcoin holding very firm and it looks bullish
BDRY Dry bulk ETF breaking out
EIDO MSCI Indonesia ETF breaking out and retesting
Some other interesting charts:
Despite a massive surge in spot steel and commodity prices, raw production is actually down. What you have to understand about steel is that it is extremely cyclical. What is the incentive to massively start producing steel over capacity. Just to push prices lower in a few years? Price fixing is illegal for this exact reason but I would imagine there is no hurry.
I'm looking at a chart of US steel and wondering, "jeez, could this be the year?"
Remember, only two trading sessions have past so far this week. Volatility can age you down. Keep thy head on a swivel, control risk and there is no need to be a hero in a market that is taking people out of business left and right.