

Discover more from Investor Charts
The Delta Between Breadth And Price
Something I have been thinking about a lot recently is the stealth bear market that has been with us really since the blow off top in ARKK names back in the spring of 2021. Breadth has been absolutely terrible since that time and the percent of S&P members above their 200-day moving average is now sitting at a dismal 36%
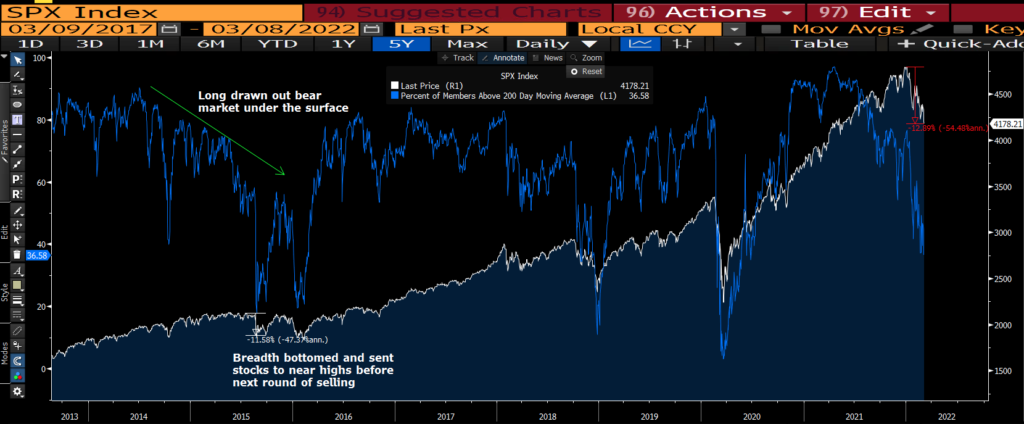
In market corrections, typically you see that metric go from ~75% to 30% very quickly. That is what makes corrections by definition, a correction. A swift downward move to wash out the "paper hands". Yes, I used the term. The last time I can remember a long drawn out breadth debacle was the period between 2014-2016. It all really started with the Ebola scare back in Oct 2014 which was one of the wildest 10% down to new high moves the market had seen in a long time.
To add insult to injury, China ended up devaluing their currency at time when market breadth was already quite poor and sent stocks lower, very quickly. A lot of ETFs ended up breaking on Aug 24th, 2015. I remember the day because I saw some preferred financial ETFs trading at pennies on the dollar for really no reason.
I'm saying all of this because I think the idea of an "external shock" coupled with poor breadth has a ton of overlay to the current market environment. The first chart I posted demonstrated a long period of poor breadth. The moment that equities started to get a bid and we were only modestly off high water mark, stocks ended up rallying significantly.
I think the point of this post was just to point out what could happen if breadth starts to move. We could very well not even have seen the lows at this point. All of the bad market action tends to happen when breadth and price action is like this. In fact, markets tend to really bottom when the reading of stocks above their 200-day moving average is closer to 20%, not 35+ as it is now.
Like I wrote about yesterday, vol still showing the creeper pattern.
Just one speculator's perspective.