Investor Charts

Share this post

The Big Chartbook

investorcharts.net

The Big Chartbook

PetrTrades
May 11, 2022
Share this post

The Big Chartbook

investorcharts.net

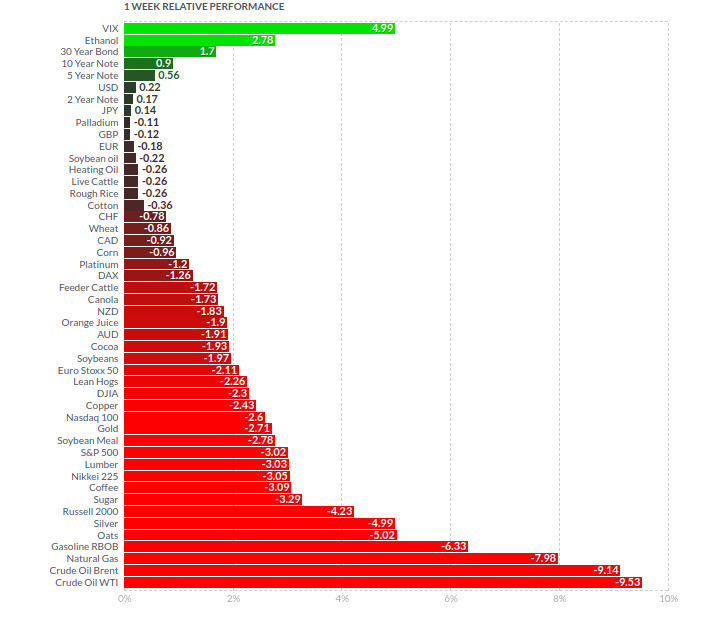
VIX still leading the charge on the risk off with bonds finally catching a bid. Currencies largely meandering around with the DXY still trading in a range near the highs. DeMARK 13 combo weekly exhaustion puts us slightly bearish.

Emerging markets might be front-running the turn in the dollar... major ETF ratios starting to trade back above their 50 day moving averages.

AAII Sentiment has never been like this bad in a long time.

What is strange though, percent of stocks above their 200 day moving average is still above 20%...really great buying opportunities for the index have come when this metric is close to the 10% mark.

Bears have momentum, but they could easily squeeze off that 13. I like owning calls in medium term. We have to admit this is is a major bear market / top that has formed across the market.

Medium term master plan could be something like this

Gold back to the 200 day moving average, miners into the lower bollinger band

Retest here on GDX. Still looks like a good risk-reward to the long side

XME 38.2% retracement above the 200 day moving average.

Undeniable relative strength over the last few days in Semi conductors

Mortgage applications continue to be dismal as rates start to creep up to 5.5% on the average mortgage.. I'm not sure if people remember just how big of a percentage of GDP homes are.

S&P and its Price / Earnings ratio..

Share this post

The Big Chartbook

investorcharts.net
TopNew

No posts

Ready for more?

© 2023 PetrTrades
Privacy ∙ Terms ∙ Collection notice
Start WritingGet the app
Substack is the home for great writing