

Discover more from Investor Charts
Technical Views After Close
Make or break setup here on ETH daily, sitting right on top of TD Prop
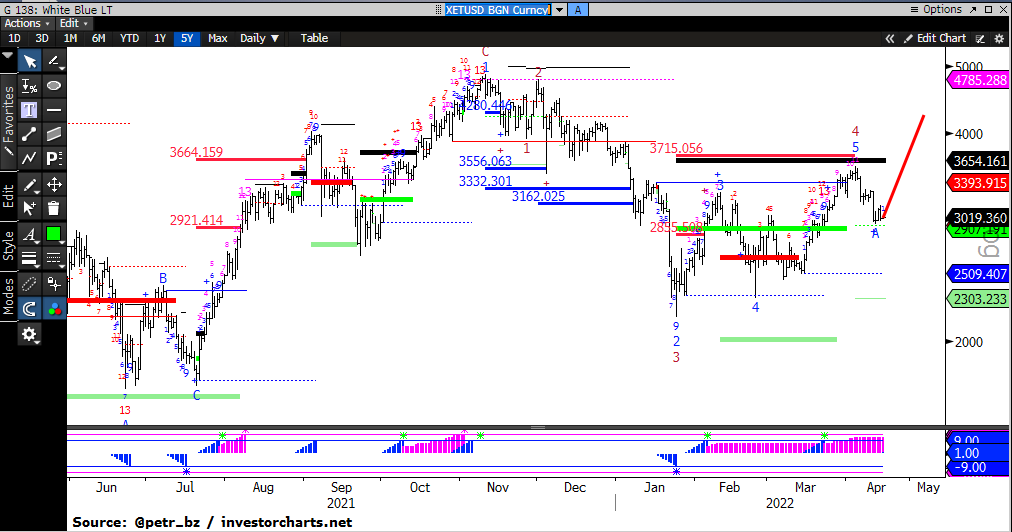
The correlation between ETH and SPX is almost 90% over the last few months -- which makes sense given just how much re-pricing of risk has happened with the rapid rise of rates. Realized correlations of risk assets have basically went to 1.
What is troubled is that the ETH/SPY ratio got a DeMARK 13 combo sell and has flipped back below TDST. That is not exactly bullish for risk if ETH is leading.
If ETH weekly has topped, this is the setup. First stop is the modest 1126 wave 3 down level.
I know that sounds extreme, but bulls will need a sharp hold here across crypto.
In tech stocks it all looks quite similar. We had that 13 Combo candle back in November which spurred the entire market into a tizzy of selling, following by: rate rises, commodity blow ups and the threat of a third world war. All of which are still basically ongoing.
QQQ completed a DeMARK 9 buy setup this week, after rallying substantially off the March 14th bottom.
The 120M chart will get a TD Sequential 13 right at the cash session open on Monday
I think the gist is that if we don't see crypto start to hold and markets rally off these short-term exhaustion signals, we have a lot more work to do on the downside.