Investor Charts

Share this post

Technical Lay Of The Land

investorcharts.net

Technical Lay Of The Land

PetrTrades
Jan 31
Share this post

Technical Lay Of The Land

investorcharts.net

Markets have come off from some clean resistance

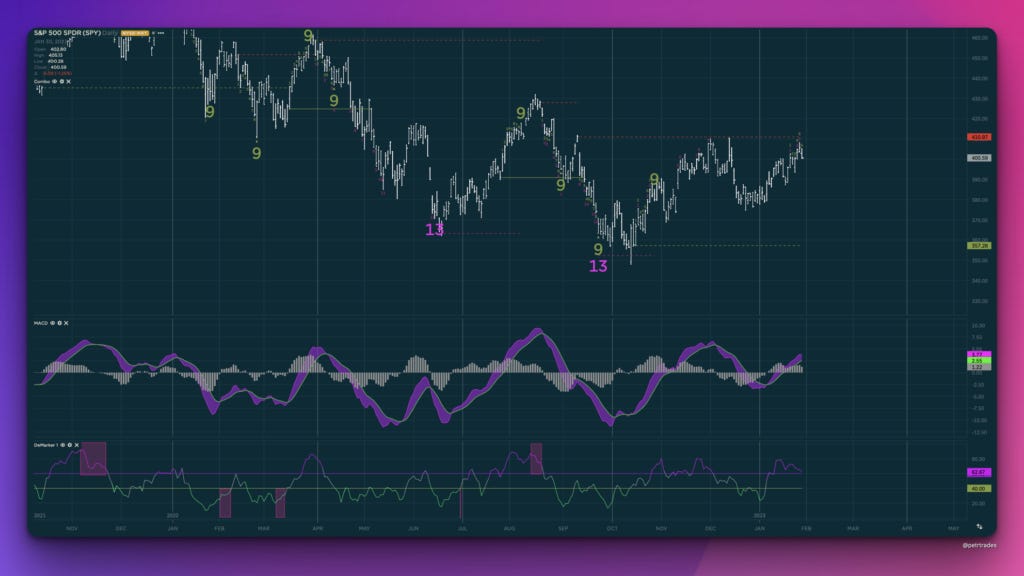
SPY reacted to the TDST level of the highs with TD Pressure sell signals. This is very much in character for the setup we have in the dollar and rates, expecting some kind of short-term pop on those and weaker stocks in the short-run.

Healthcare was one of the worst performers on a week over week basis, and the chart is now breaking down with trends showing their stance to the downside.

If you look at USDJPY from a DeMARK perspective, this is telling what the market is expecting in my view

The 10-year looks ready to maintain its upward trend in the short-run

CVX gave up its entire upward trend move, and is now flirting to break down from trend

Even looking at something like the financials, which have been leading, we have clean TD Pressure sell signals and it looks like it could be a big false breakout

BAC looks like the relative laggard for that trade with a clean risk-reward

Goldman too, but we would need it to trade below the 9EMA for an actionable signal

Even GDX is concurring with the setup in the dollar

Natural Gas DeMARK 13 Combo and 9 buy setup

Preferred share ETF with a TD Combo 13 sell

BDRY could be telling the same story as Natural Gas

Lending Tree, the favorite short from a lot of hedge funds looking for levered loaners in a down market, has squeezed significantly and is now completing a Combo 13.

And finally, the most important chart in this series -- a combo 13 on VT. Tread carefully here.

Share this post

Technical Lay Of The Land

investorcharts.net
TopNew

No posts

Ready for more?

© 2023 PetrTrades
Privacy ∙ Terms ∙ Collection notice
Start WritingGet the app
Substack is the home for great writing