

Discover more from Investor Charts / P1 Analytics
Talking Briefly (stocks, bonds, crypto, semis, coinbase)
As of the last post, we had a bearish stance on US markets.
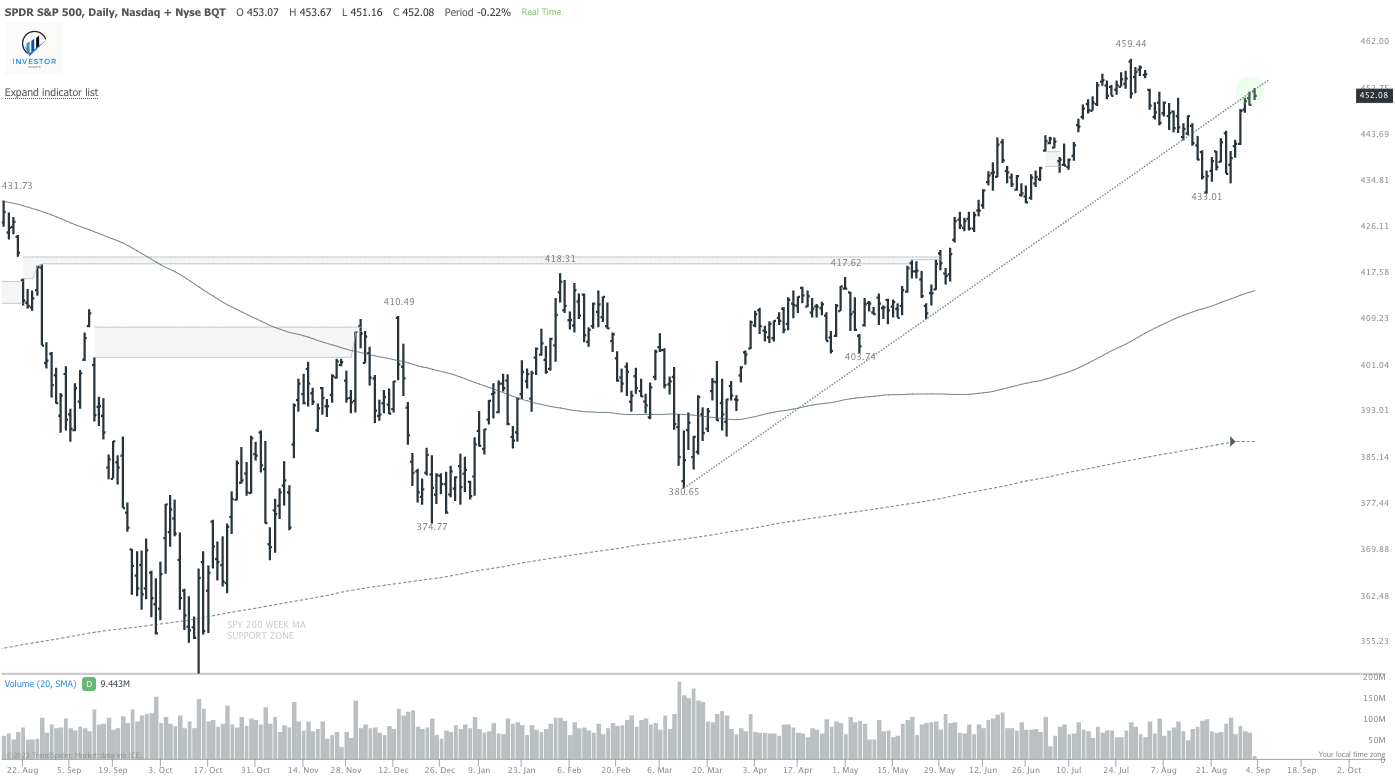
This was the chart that was posted:
And follow up:
So what, who cares. Any nit can make a call. Lets talk about what I see next.
The big news item is that we finally had a 1.5% decline, breaking a streak we have not seen since 2018! Wild to believe.
I did a quick backtest on this and didn’t find much. It has happened 40 times on the S&P 500 index where we had more than 100 days between and the results are below.
My general bias is actually to start thinking about fading weakness. It might be unpopular given literally everything technical is saying the opposite, but we are into broad support and we have to look at credit conditions. Look at credit spreads. Nada.
Small caps are entering a gap fill pocket here
I am looking at 175 area for support
Look at crypto… if anything is going down quick and fast and a good “high beta risk proxy”, its Bitcoin. Still holding a nice up channel.
Micron.. still way above the 200 week and retesting a breakout.
One of the most interesting charts is t-bond futures. Back in late 2018, I did this trade on the long side in the fade of rising rates and markets falling off a cliff. This feels identical in every way, shape and form. I would wait for some support to manifest itself, but the idea is there for me to pull the trigger once I see it.
A chart that is also interesting for me here is COIN, retesting a breakout spot and uncompleted gap fill
Friendly reminder I’m a nobody and just writing my stream of consciousness. Hopefully this is helpful to someone out there, but wanted to make a quick blurb. Bless!