

Discover more from Investor Charts
So, we bounced. What Now?
Earlier this week I put a post out about getting back into equities. A lot of markets are now starting to turn and we are finally seeing a breadth improvement starting to take form. The chart below you can see that the % of stocks above their 50 and 200 day moving averages in the SPX is starting to perk up after a bottoming base.
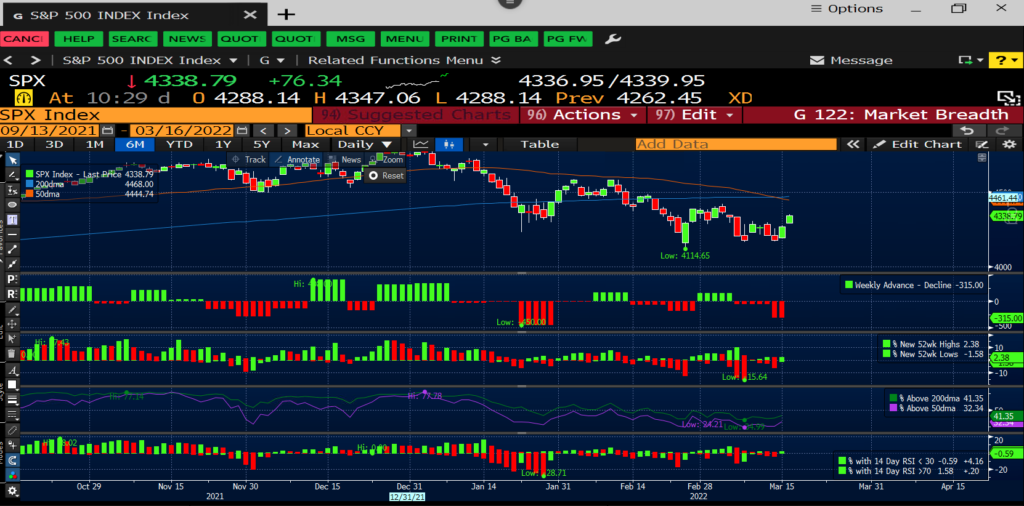
While the S&P has been holding below its 200-day moving average, one has to wonder if this level of breadth improvement which equates to a 1.5% rally in SPX would mean if there was actually a 20-30% breadth improvement could mean we would be back to the 4500-4900 SPX region in short order.
The chart below shows the VTI (World Equity ETF) have a price flip after completing a DeMARK 13 sequential bottom. You rarely see these, let alone back to back within the span of a couple of months.
I've been legging into CRWD and a few other names over the last week and it is finally starting to work in my favor. The HACK ETF completed a DeMARK 13 sequential which I posted about in yesterday's DeMARK scan.
I'm still very much bullish on rates going higher. However, there is a lot of uncertainty with this FOMC meeting today. First, everyone is short. That doesn't mean that this is somehow bullish for bonds, but it just means that during economic events I would expect the one way positioning to go the other way. We priced in a lot of hikes already.
I think it is reasonable to wait until the end of the week in case they squeeze some bond shorts and then one can hop back on the short wave in bonds.
Investment grade CDS finally starting to come down, signaling that risks for owning stocks should be lower.
Hopefully you are all killing it. I lightened up a bit on this rally / FOMC coming up soon. I will have more concretes thoughts after the close.