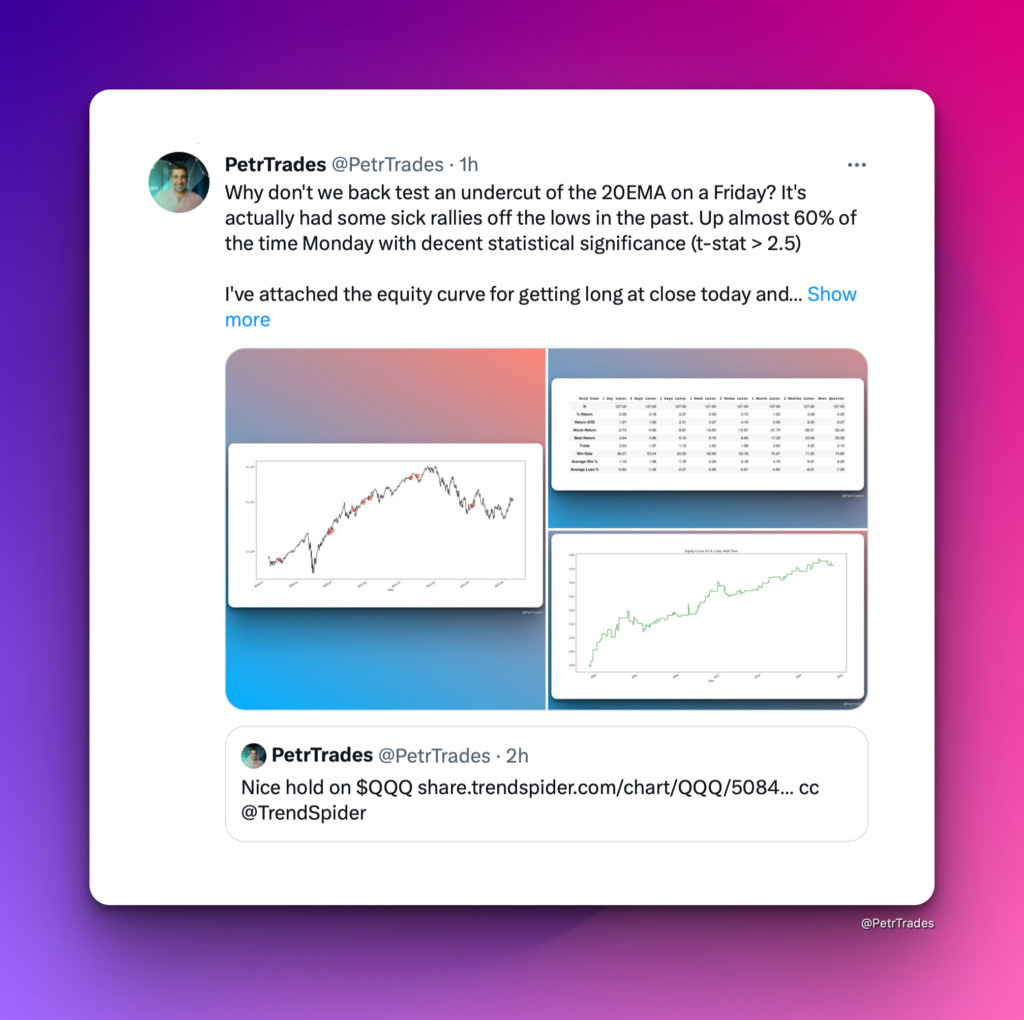
Dow Jones Coiled Up And Nasdaq 20EMA
QQQ Higher Low 20 EMA Hold
First, check out these backtests on the QQQ holding up the 20 EMA:
Dow Coil Up
Bollinger Bands are a technical analysis tool used to measure the volatility of a financial instrument. The bands consist of a simple moving average, usually over a 20-day period, along with upper and lower bands that are set two standard deviations away from the moving average. When the Bollinger Band width is low, it indicates that the price of the financial instrument is experiencing low volatility and is likely to experience a sharp price move in one direction or the other.
In the case of the Dow Jones, a low Bollinger Band width has historically led to sharp price moves in either direction. When the market is experiencing low volatility, it is often a sign that traders are uncertain about the direction of the market and are waiting for a catalyst to move the market in one direction or the other. This uncertainty can result in large swings in the market when a catalyst finally emerges.
Most recently, the Dow Jones has been at the lowest point in the Bollinger Band width in a long time.
Nasdaq Breadth
The NAHL Index, also known as the Nasdaq New Highs Lows Index, is a technical analysis tool that measures the number of stocks that are reaching new 52-week highs versus those reaching new 52-week lows on the Nasdaq exchange. The index is calculated by subtracting the number of stocks making new 52-week lows from the number of stocks making new 52-week highs and dividing the result by the total number of stocks traded on the Nasdaq exchange.
The NAHL Index is a useful tool for traders and investors to gain insight into the overall health of the Nasdaq market. When the number of stocks making new 52-week highs is greater than those making new 52-week lows, the NAHL Index will be positive. This indicates that the market is in an uptrend and is generally considered to be a bullish signal. Conversely, when the number of stocks making new 52-week lows is greater than those making new 52-week highs, the NAHL Index will be negative. This indicates that the market is in a downtrend and is generally considered to be a bearish signal.
Most recently, NAHL continues to show encouraging signs of breadth hanging in relative to prices undercutting ranges.