

Discover more from Investor Charts
A close below the 50-day moving average...
Great opportunity to backtest what typically happens to the S&P 500 when it closes below the 50 day moving average. I am using Emini S&P Futures since 2013 in this example.
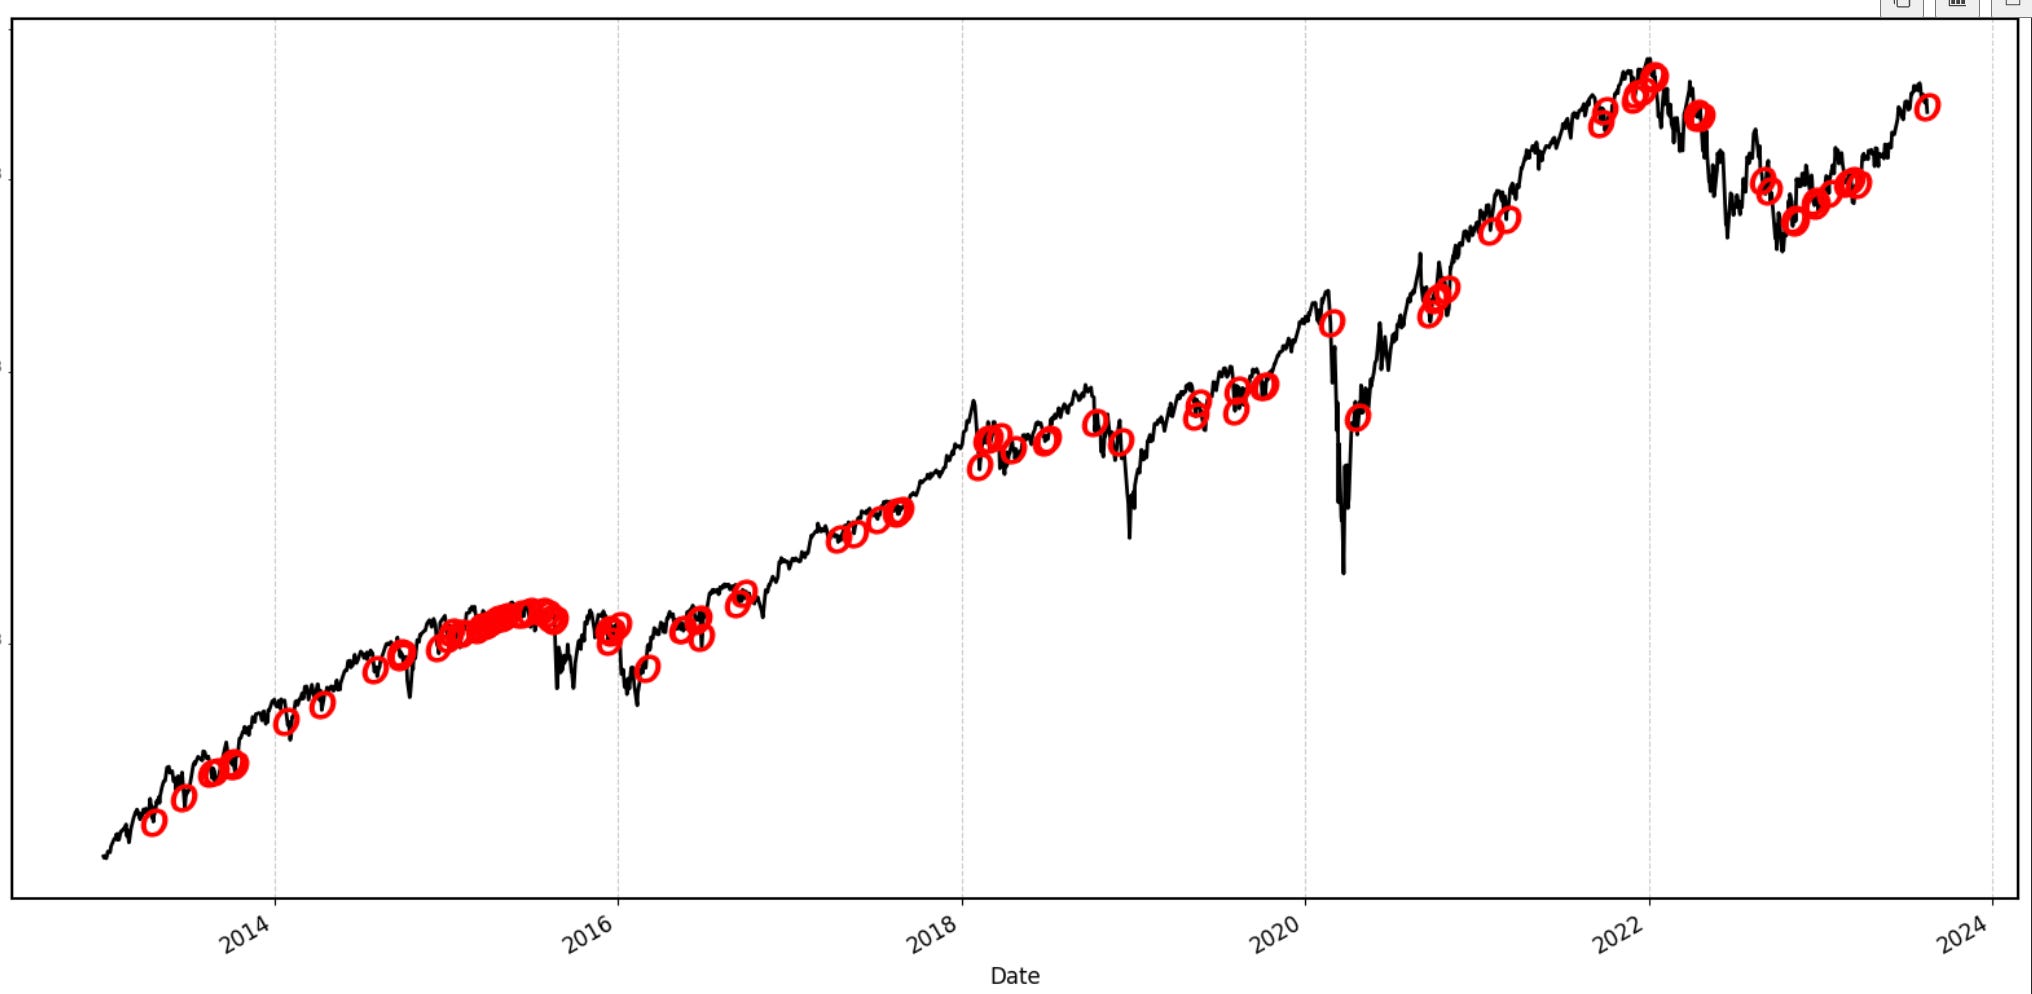
This has happened 94 independent times since the time series began. I’m calling it independent, because we are only looking the first time the close below the 50-day happens. It could also close back above the following day — and if it closes back below the corresponding day, it would count as well. However, the gist is that these do not include back-to-back data if the close is simply below the 50-day moving average but rather the day of the event.
The gist is you don’t need to be a genius to buy dips, which is obviously harder said than done. The tricky part is avoiding the really painful moments in volatile situations.
On average, the market seems to be higher one week (5 biz days) later almost 70% of the time. Even during Covid and the big down market we saw in 2021, the strategy did okay just buying breaks below the 50-day moving average.
The gist? Don’t underestimate bear market reversals. I’ll be looking to head my own advice.